
Skill
Where it works: Claude.ai, Cowork, Claude Code, Codex, Cursor and other agents that read SKILL.md files
Best for: The guided interview, audits and written reports
TorqueSight · Process intelligence for AI agents
TorqueSight is a skill for Claude, Claude Cowork, Claude Code and OpenAI Codex. Describe the agent system you want, or point it at one you already have. It draws a BPMN map of every agent, scores each agent's health and cost from your run logs, ranks the fixes worth making, and reviews whether your agents are safe, all in one offline viewer. It is not an agent framework. It sits above whatever runs your agents and never sees your data.
That is process intelligence for AI agents: you see inside the process your agents run.
One engine, three ways in: a skill, a CLI and an MCP server. Runs on your machine. Juggernaut never sees your data.
TorqueSight runs the same engine three ways, and all three give the same numbers.
Where it works: Claude.ai, Cowork, Claude Code, Codex, Cursor and other agents that read SKILL.md files
Best for: The guided interview, audits and written reports
Where it works: Any terminal
Best for: Scripts and quick runs
torquesight validate harness.yamlWhere it works: Claude Code, Codex, Gemini CLI, Cursor, VS Code, Windsurf, Claude Desktop and n8n
Best for: Agents that check pipeline health while they work, and n8n workflows that call TorqueSight as a step
The MCP server runs on your machine, uses only the Python standard library, makes no network calls and never edits your blueprints, prompts or code. Read the MCP guide
Logs tell you what one call did. TorqueSight shows you the whole process your agents run, and how every run moved through it.
Your blueprint becomes a BPMN map: every agent, decision, parallel step, retry loop, timer and human approval, in the lanes that own them.
Your run logs land on the map. Each agent gets a health and a cost score, and the As run view shows which paths real runs took and how often each loop fired.
TorqueSight ranks the fixes worth making with an estimated saving, predicts risky agents before they fail, and flags agents that could act on untrusted input without approval.
Built for n8n
Download your workflow and import it, then import n8n's own execution history. You get the BPMN map, agent health and cost, prompt changes that made an agent worse, and ranked fixes, with no changes to your workflows.
Every agent, decision, parallel split, retry loop, timer, error handler and human approval, in a viewer you can search, zoom and share links into. Exports to BPMN 2.0 for bpmn.io and Camunda.
A single offline HTML file with nine tabs: the map, the process, health, runs, cost and fixes, security, readiness, every report, and the source blueprint and prompts.
Fifteen optimizer rules find prompt regressions, retry loops, timeouts, premium models on simple jobs and reviewers that rewrite instead of patching, each with an estimated saving and a test to run first.
Before any run, a readiness score for every agent from the blueprint and a short interview, so you know which agents are shaky before they fail.
Each agent scored against the Rule of Two: untrusted input, sensitive data and the ability to act. Seven checks, no attacks, no code execution.
No server, no account, no telemetry. The recorder writes metadata only to your own logs, and you bring the logs to TorqueSight. Juggernaut Dev never receives anything.
Process intelligence, also called process mining, takes the event logs a business already produces, rebuilds the real process from them, and shows where it is slow, costly or risky. Companies have used it for years on supply chains, finance and customer service.
TorqueSight brings process intelligence to AI agents. Your blueprint and your agents' run logs become a live process map, with health, cost and safety on every step.
| Aspect | Agent observability | Process intelligence with TorqueSight |
|---|---|---|
| What you look at | One trace or one model call at a time | The whole process across every run |
| The question it answers | What happened in this call? | Where does the process break, what does it cost, and what should change? |
| What you get | Traces, logs and dashboards | A BPMN map, health and cost per agent, ranked fixes, a risk register and a security review |
| People and approvals | Usually out of view | Drawn in their own lanes, with timers and escalations |
| Starting point | A tracing SDK or proxy in your code | What you already have: n8n history, OpenTelemetry traces, Langfuse exports, or a small recorder |
TorqueSight does not replace your observability tool. It reads what that tool already collects and turns it into a process you can see, score and improve.
The TorqueSight viewer is one HTML file that opens in any browser, offline. Pick a tab to see what it shows, then open the same tab in a live demo built from a 25-agent claims process.
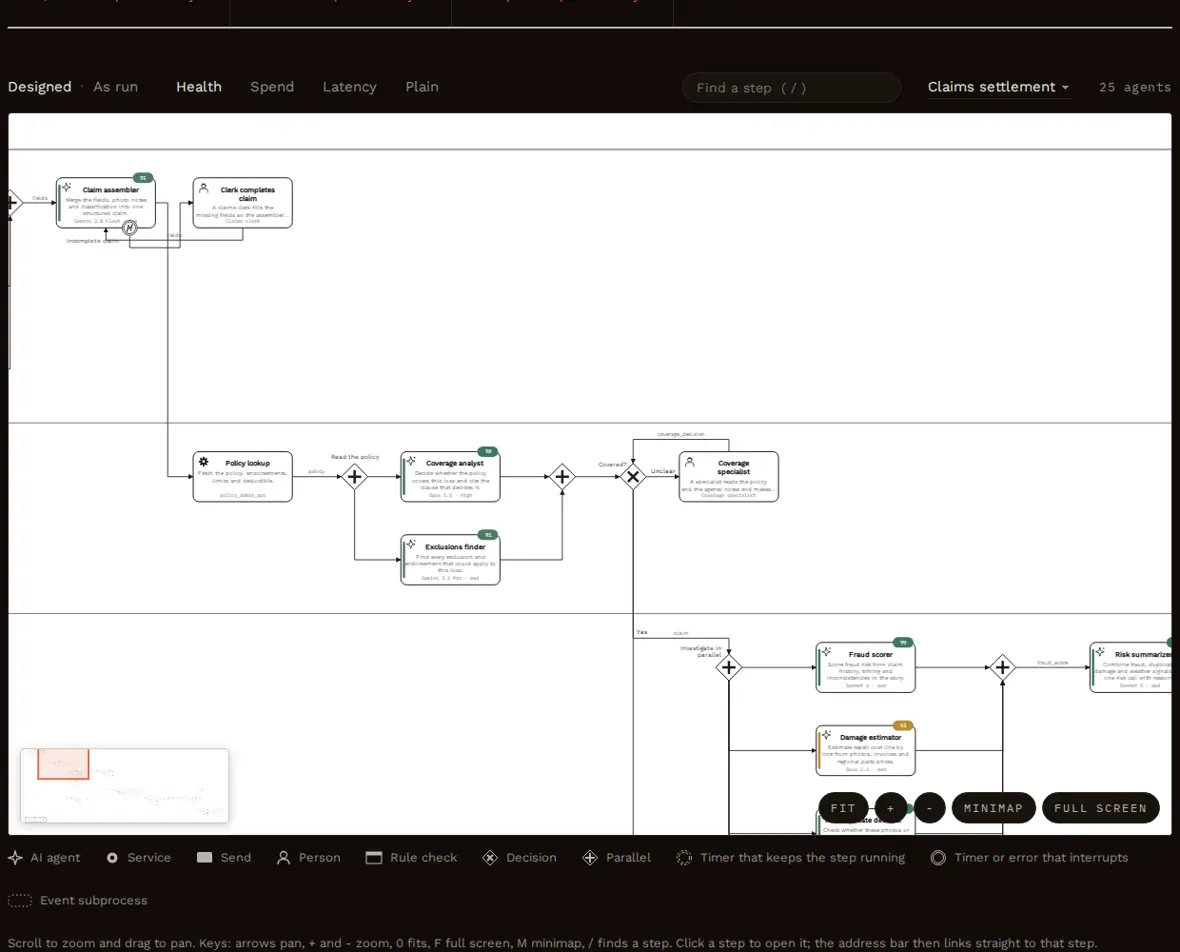
Lanes, agents with their jobs, decisions, parallel work, retry loops, timers and human approvals. Switch between Designed and As run, color the steps by health, spend or latency, search for a step, and move around a long process with the minimap, the keyboard and full screen. Clicking a step opens it and puts a link to that step in the address bar, so you can send it to a colleague.
Open the Map tab in the live demo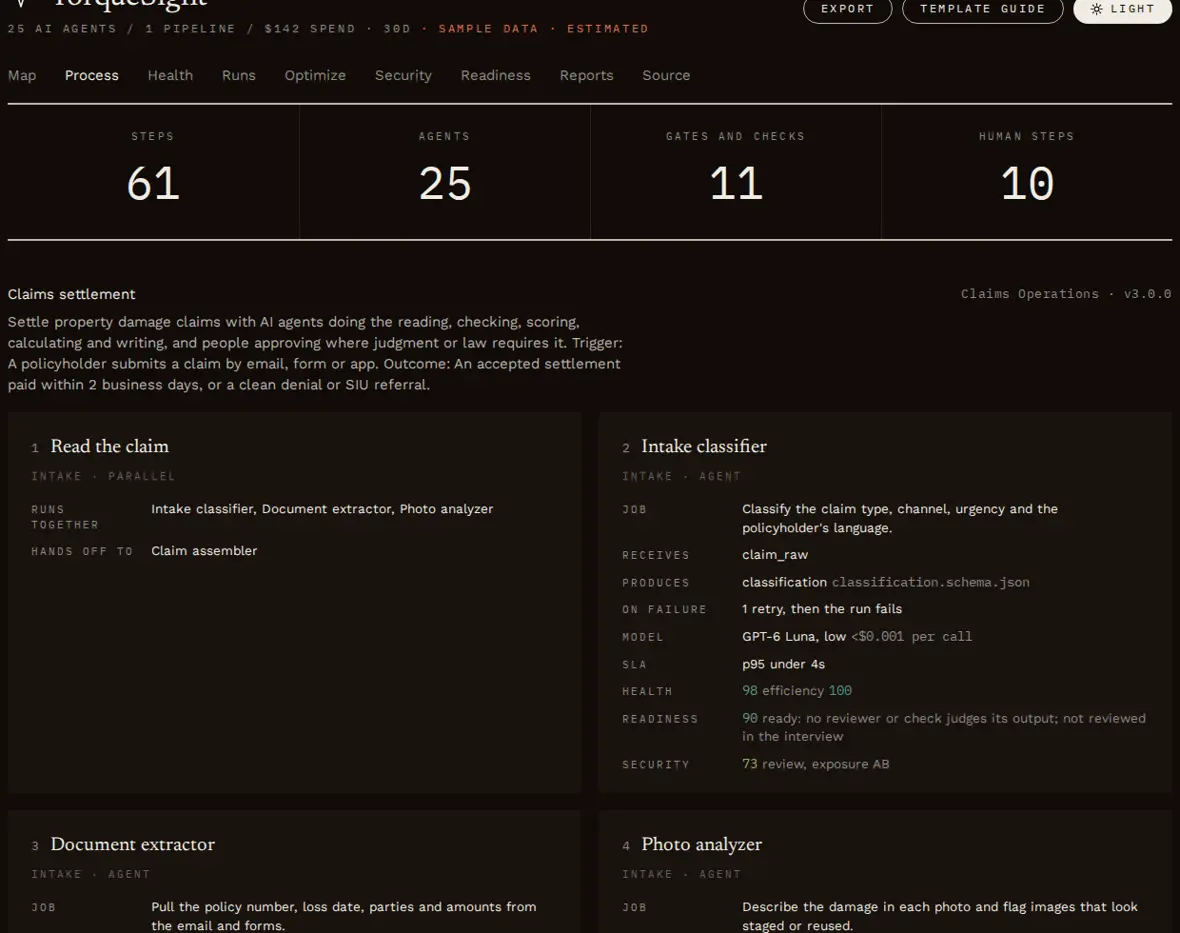
Each card shows the step's job, what it receives and from whom, the context it is given, what it produces, where it hands off, its timers and error handlers, its model and limits, and its readiness and security scores.
Open the Process tab in the live demo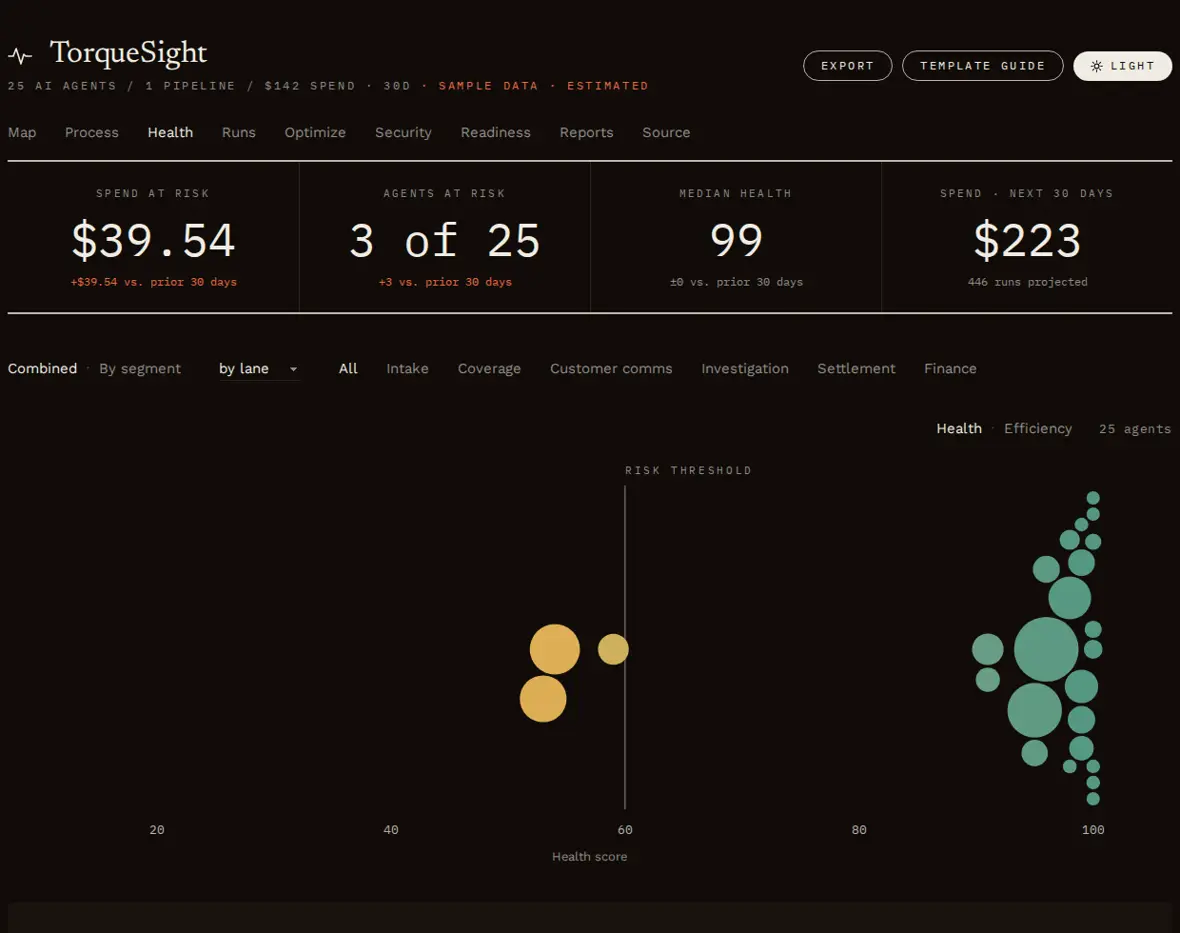
Every AI agent is a bubble placed by health score and sized by spend, with a watchlist of drift, prompt versions and budget runway. Click an agent for its 30-day trajectory and exactly what is pulling its score down.
Open the Health tab in the live demo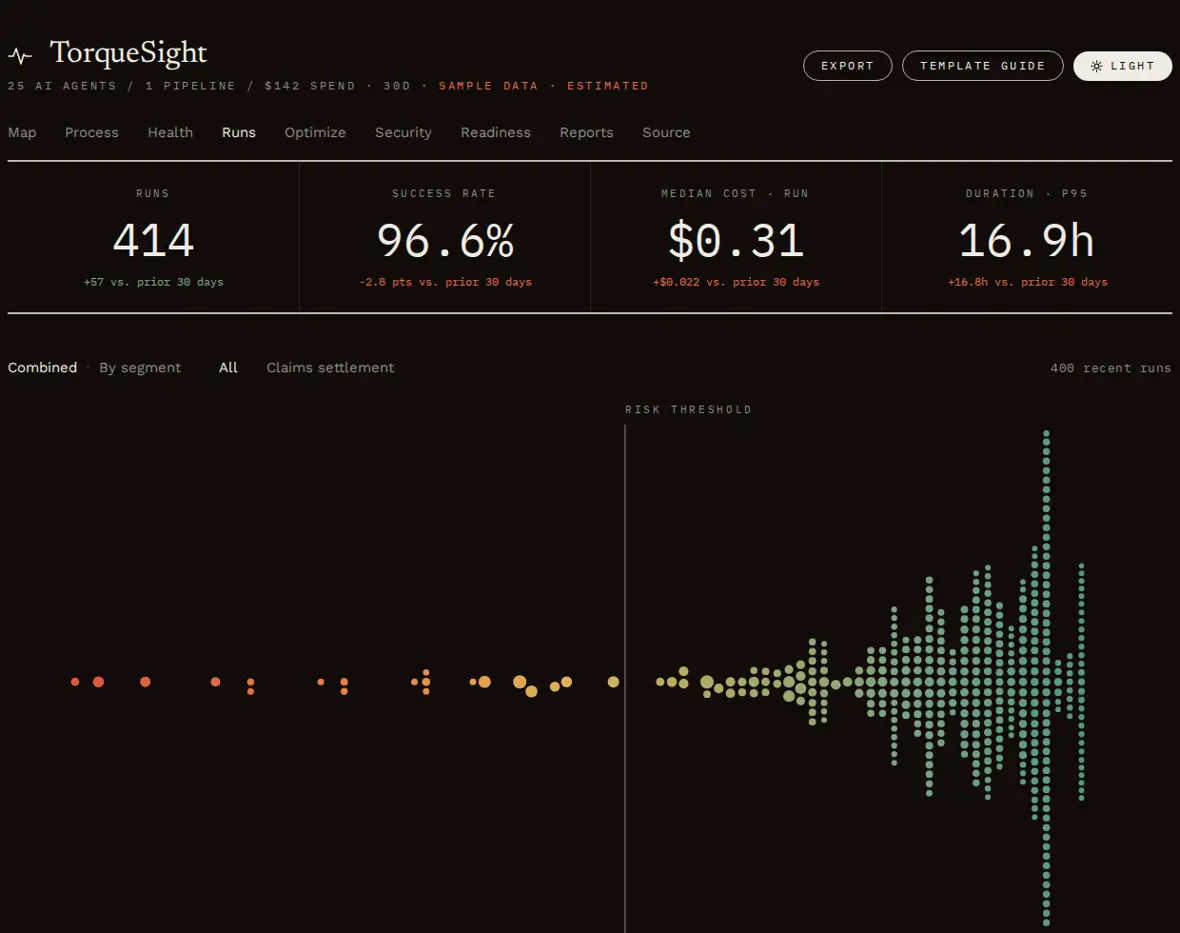
Every recent run by score and cost, the runs that failed or went over budget, and a step-by-step timeline of any run.
Open the Runs tab in the live demo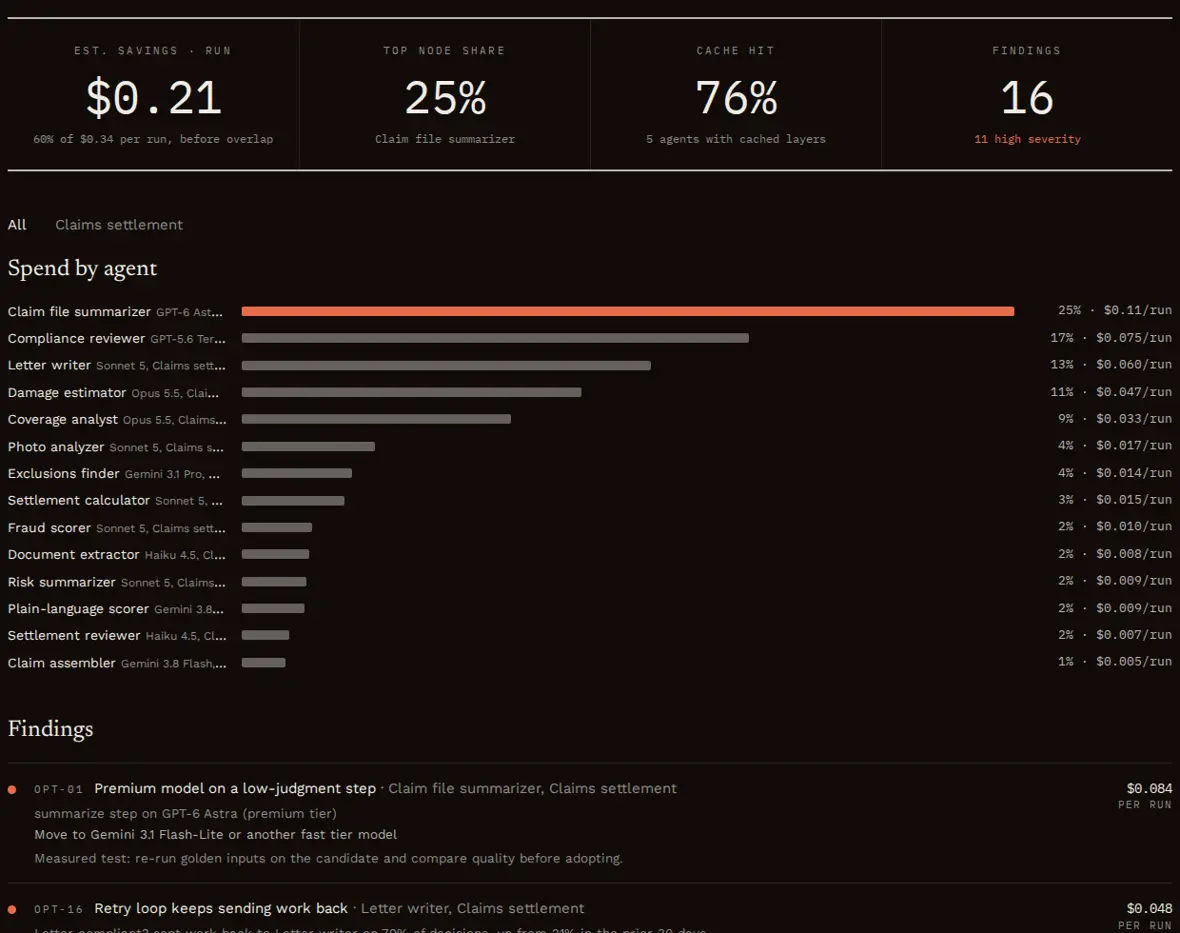
Spend by agent over 30 days, ranked fixes with their evidence and estimated savings, and a what-if table to try a cheaper model before you change anything.
Open the Optimize tab in the live demo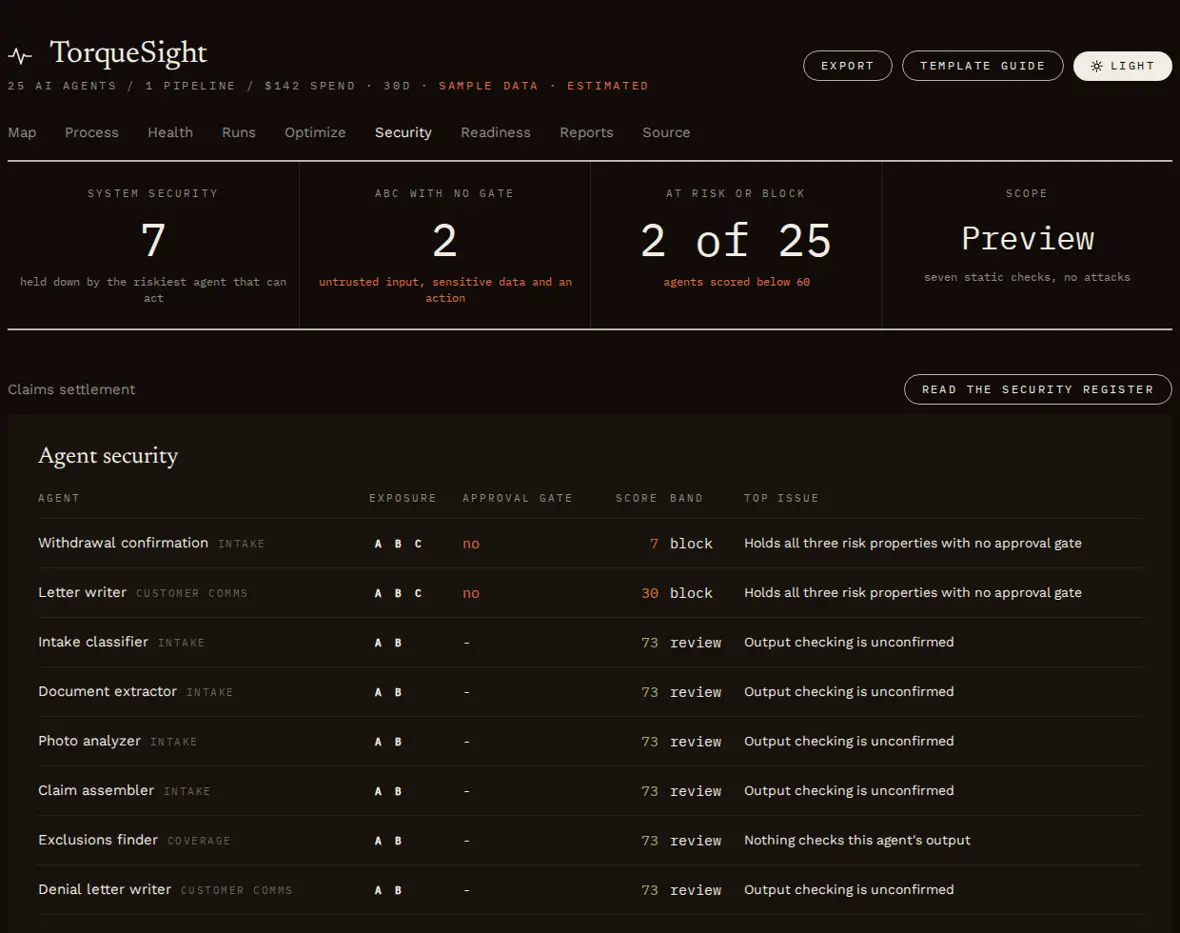
Each agent's exposure to three risk properties: untrusted input, sensitive data and the ability to act. Agents with all three and no human approval rise to the top, each with its fix. Static review only; nothing is attacked.
Open the Security tab in the live demo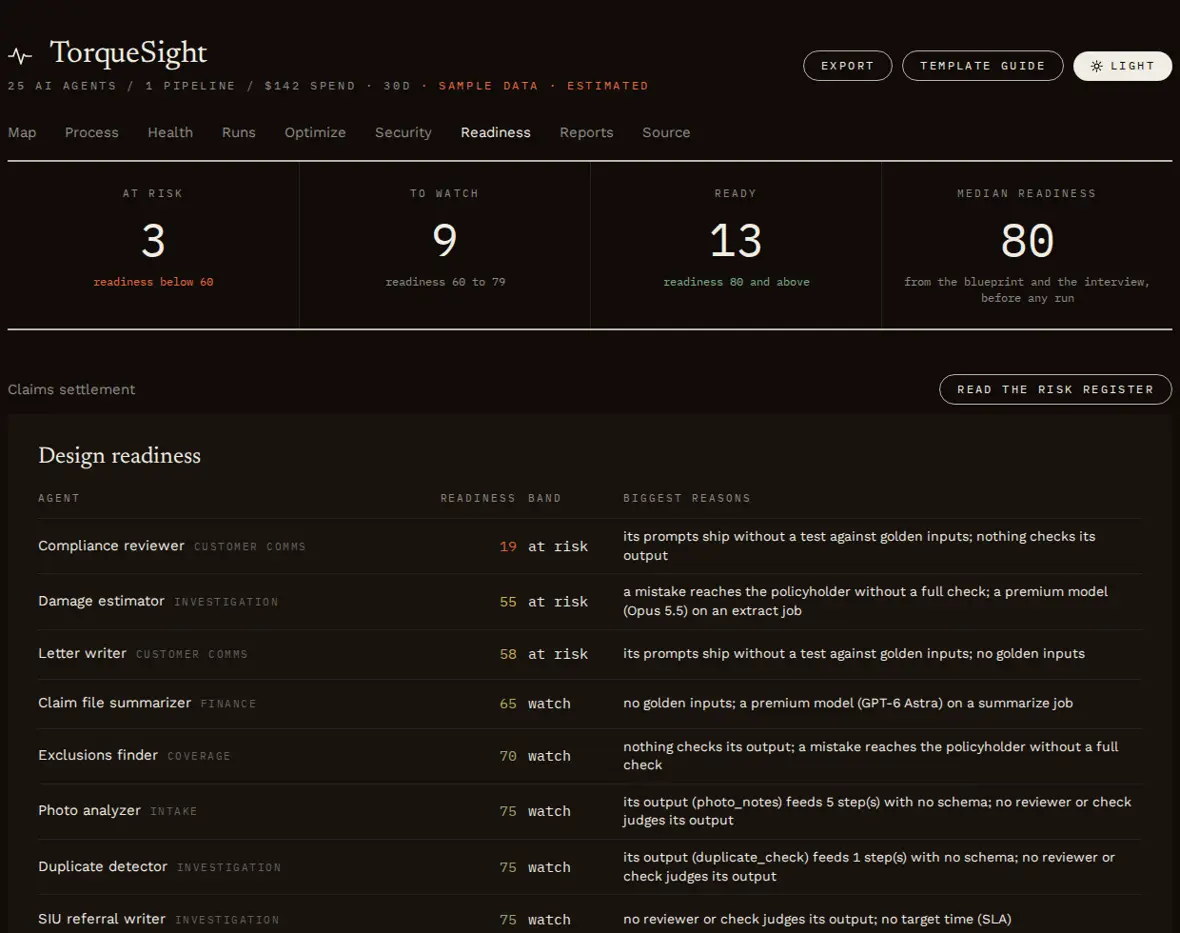
Which agents are likely to struggle, predicted from the design and the interview before any run, so you can fix them before they fail.
Open the Readiness tab in the live demo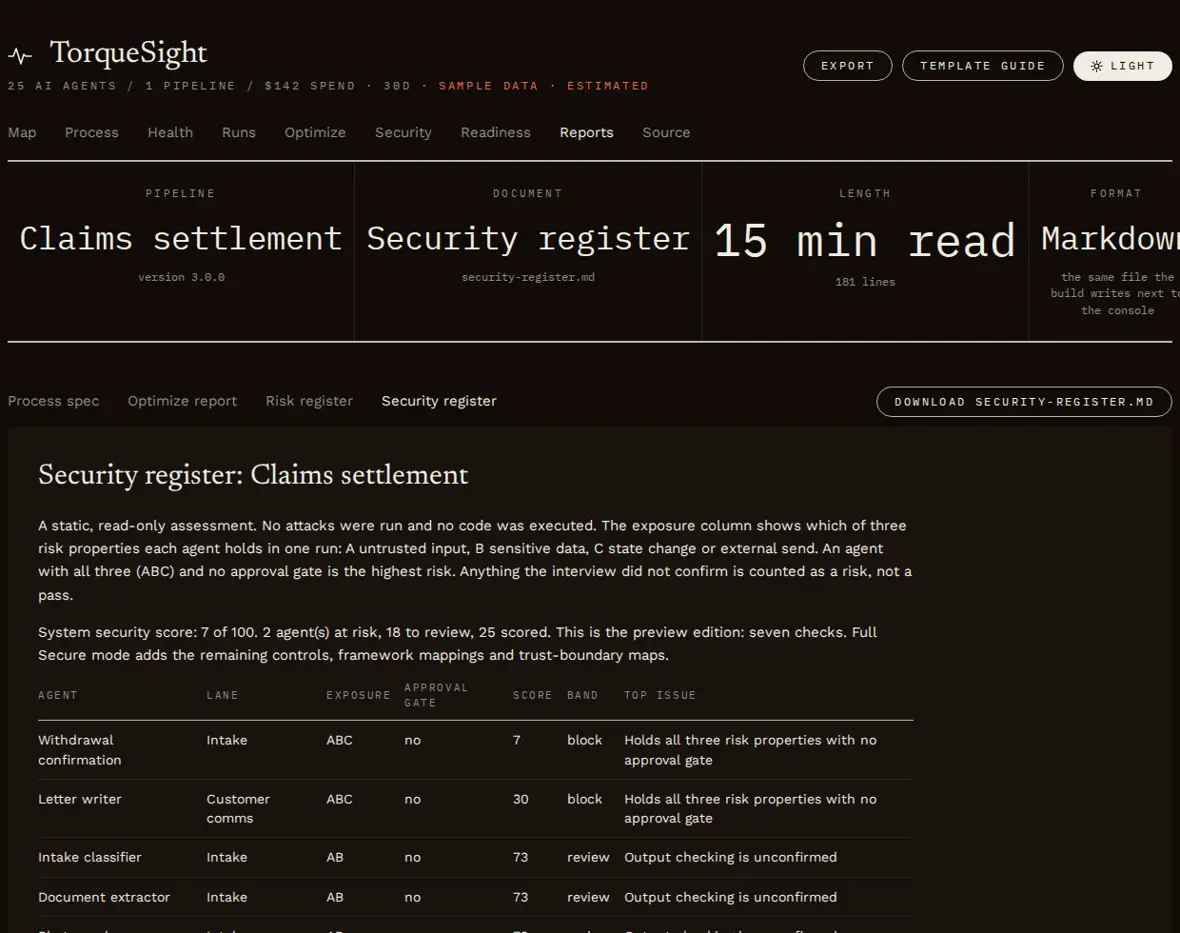
The process spec, the optimize report, the risk register and the security register, rendered and ready to download.
Open the Reports tab in the live demo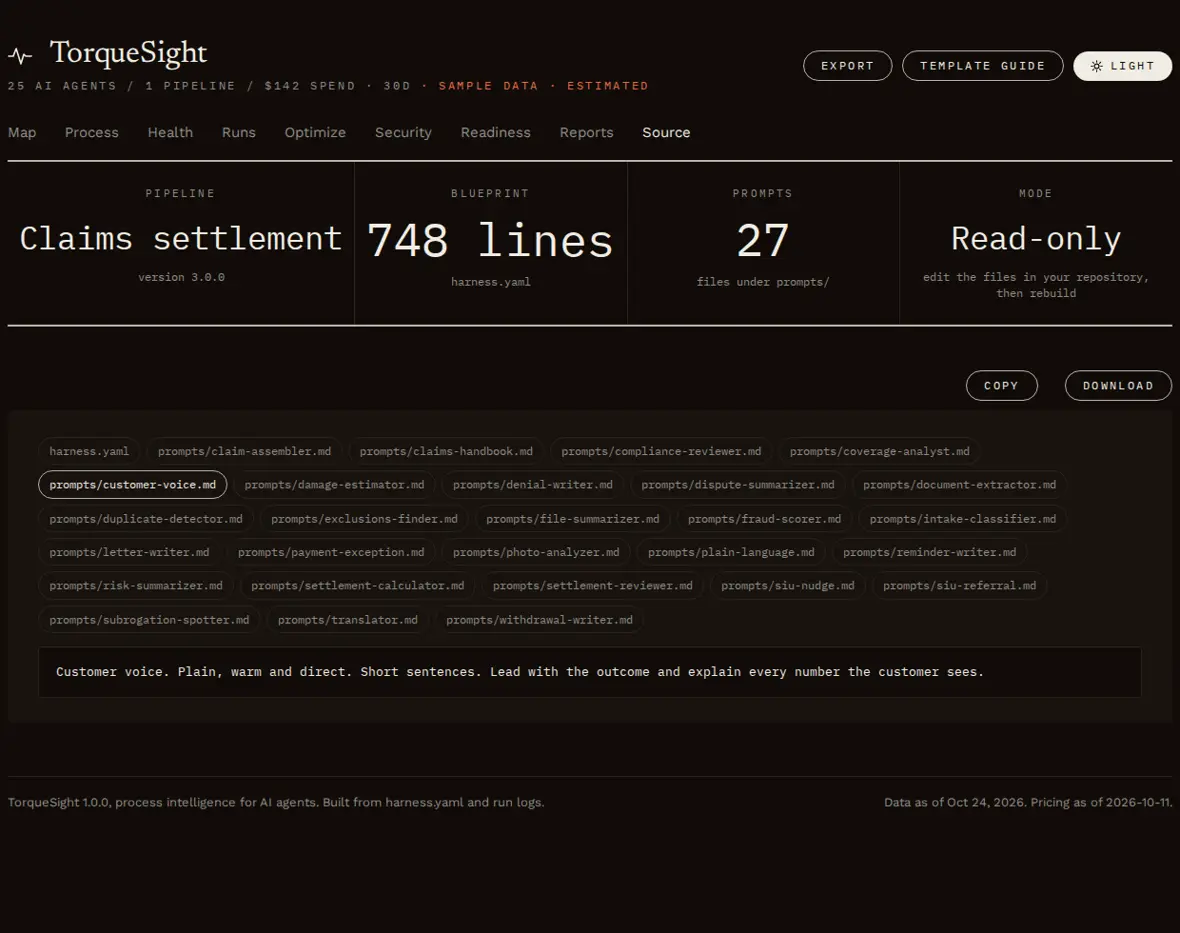
The whole blueprint and each prompt file, read-only, with copy and download, so the console is the one place to see everything.
Open the Source tab in the live demoBPMN (Business Process Model and Notation) is the international standard for drawing a process, published as ISO/IEC 19510. Its shapes are simple and consistent, so a developer, a business owner and an auditor can read the same picture. Here is a small agent process drawn the way TorqueSight draws yours.
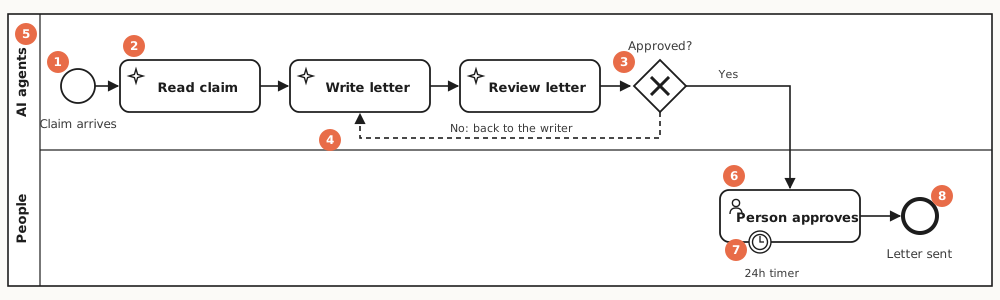
Code shows one developer what happens. A BPMN map shows the whole team, including the people who approve, audit or pay for the work.
Where agents hand off, where people approve, where work loops back, where a timeout fires, and where a mistake can reach a customer.
The same map exports as BPMN 2.0 and opens in bpmn.io or Camunda, so it fits the tools process teams already use.
Steps are colored by health, spend or latency, and As run shows which paths real runs took and how often each loop fired.
Bring your own logs. TorqueSight reads a blueprint and a run log and never connects to your systems. Pick your stack to see exactly how it connects.
No code changes. TorqueSight reads history your platform already keeps.
Send their traces to a collector you run, then import the file.
One file with no dependencies, called from the place every model call passes through.
20 platform guides, each also available as its own page.
Each demo is the real console, a single offline HTML file built from sample data. It opens in a new tab.
A 25-agent claims process with 10 human approvals. The flagship example: the BPMN map, health, cost, ranked fixes, the security review and every report.
Built entirely from an n8n workflow export and its execution history, with no hand-written blueprint. It finds a drafter that got worse after its system message was edited.
One console across claims, support triage, research, marketing content and code review, to see how the viewer handles several pipelines at once.
An open-source skill and toolkit that brings process intelligence to AI agents. It maps your agents as a BPMN process, scores each agent's health and cost from your run logs, ranks the fixes worth making, and reviews whether the agents are safe.
No. It does not run your agents. It sits above whatever already runs them, such as n8n, LangGraph, CrewAI, the OpenAI Agents SDK or the Claude Agent SDK, and reads the history they produce.
Observability tools show what happened inside a single call or trace. TorqueSight shows the whole process across every run: where it breaks, what it costs and what to fix. It can import data from tools such as Langfuse and OpenTelemetry.
No. There is no TorqueSight server, account or telemetry. It runs in your Claude or Codex session and on your machine, reads logs you provide, and its recorder writes metadata only to your own logs.
n8n, OpenTelemetry, Langfuse, LangChain, LangGraph, CrewAI, the OpenAI Agents SDK, the Claude Agent SDK, Google ADK, Strands, Mastra, the Vercel AI SDK, Pydantic AI, LlamaIndex, Amazon Bedrock, Bedrock AgentCore, Azure AI Foundry, Lovable, the Anthropic and OpenAI APIs, and xAI Grok.
Yes. TorqueSight is open source under the Apache-2.0 license. TorqueSight Enterprise, a delivery kit deployed in your own cloud, is coming soon.
No. Claude.ai and Cowork use the skill, which runs the same engine inside Claude's sandbox. The MCP server is for apps that run on your computer, such as Claude Code, Codex, Gemini CLI, Cursor, VS Code, Windsurf, Claude Desktop and n8n.
It runs locally, makes no network calls, never runs a shell, and reads and writes only inside your project folder. It never edits your blueprints, prompts or code, and it labels everything from your logs as data so an injected instruction in a log is never followed. A read-only mode writes no files at all.
No. The skill, CLI and MCP server all run where you run them. Juggernaut never sees your blueprints, prompts or run logs.
Both protocol eras: the initialize handshake from 2024-11-05 through 2025-11-25, and the stateless 2026-07-28 revision. It is tested against the official MCP Python SDK over stdio and HTTP.
n8n Cloud cannot reach a program on your computer. Use the MCP server with self-hosted n8n, or export your execution history and run TorqueSight on it with the skill or the CLI.
The fastest start, for Claude Code, Codex, Cursor and most other coding agents:
npx skills add YOURORG/torquesightThat installs the skill. Pick your app below to add the MCP server's typed tools as well.
Install the plugin. It brings the skill, the /torquesight:audit, /torquesight:health and /torquesight:optimize commands, the reviewer agent and the MCP server, which starts on its own.
/plugin marketplace add YOURORG/torquesight
/plugin install torquesight@juggernautRestart Claude Code, then run /mcp to confirm torquesight is connected.
Claude.ai on the web cannot reach a program on your computer, so it uses the skill, which runs the same engine inside Claude's sandbox.
npx skills add YOURORG/torquesight
codex mcp add torquesight -- python3 /path/to/torquesight/mcp-server/torquesight_mcp.pyConsole builds on large logs can take longer than Codex's default tool timeout, so raise it in ~/.codex/config.toml:
[mcp_servers.torquesight]
command = "python3"
args = ["/path/to/torquesight/mcp-server/torquesight_mcp.py"]
tool_timeout_sec = 300gemini extensions install https://github.com/YOURORG/torquesightThe extension bundles the MCP server and a context file that teaches Gemini the TorqueSight workflow.
Clone the repository, then print the exact setup with every path filled in:
git clone https://github.com/YOURORG/torquesight.git
cd torquesight
python3 mcp-server/torquesight_mcp.py wrap cursorUse wrap windsurf for Windsurf. For Cursor, the result goes in ~/.cursor/mcp.json and looks like this:
{
  "mcpServers": {
    "torquesight": {
      "command": "python3",
      "args": ["/path/to/torquesight/mcp-server/torquesight_mcp.py"]
    }
  }
}Add this to .vscode/mcp.json in your project:
{
  "servers": {
    "torquesight": {
      "type": "stdio",
      "command": "python3",
      "args": ["/path/to/torquesight/mcp-server/torquesight_mcp.py"]
    }
  }
}Open Settings, then Developer, then Edit Config, add this block, and restart Claude Desktop. The --root folder is the project TorqueSight may read.
{
  "mcpServers": {
    "torquesight": {
      "command": "python3",
      "args": ["/path/to/torquesight/mcp-server/torquesight_mcp.py", "--root", "/path/to/your/project"]
    }
  }
}python3 /path/to/torquesight/mcp-server/torquesight_mcp.py --http --port 8765n8n in Docker on Linux, or on another machine, needs a token and Header Auth. The MCP guide covers it.
python3 mcp-server/torquesight_mcp.py doctorIt checks Python, PyYAML and the engine, and tells you what to fix.
Requirements: Python 3.8 or newer, and PyYAML for YAML blueprints. Nothing else.
The skill teaches an agent how to interview you and read the results. The MCP server lets any agent ask TorqueSight questions while it works.
An agent can ask which stage in its last 50 runs has the worst retry rate and get structured rows back, instead of reading log files.
The MCP Client Tool node connects to TorqueSight, so a nightly workflow can run a health check after each batch and branch on the result.
Codex, Gemini CLI, Cursor, VS Code and Windsurf get the same tools and the same numbers, with no new skill format.
Every tool has a schema, pagination and evidence, and the audit, health, optimize and security prompts show up as commands in clients that support them.
11 tools
torquesight_validate_blueprintSchema and rule errors, and unmapped steps in the run logs
Read onlytorquesight_get_process_mapThe designed process as steps and connections
Read onlytorquesight_importBlueprints from n8n or BPMN; run logs from n8n executions, OpenTelemetry or Langfuse
torquesight_get_stage_healthPer-agent success, retries, latency, tokens and score
Read onlytorquesight_find_bottlenecksThe worst failure points, with the run ids that prove them
Read onlytorquesight_compare_windowsBefore and after a prompt, model or workflow change
Read onlytorquesight_get_runOne run's path, failures and loop decisions
Read onlytorquesight_optimizeRanked fixes with evidence and a proposed patch that is never applied
torquesight_security_reviewA static review of the agents themselves that never generates attacks
torquesight_risk_registerDesign readiness before any logs exist
torquesight_build_outputsThe offline console, BPMN 2.0, SVG map and Markdown spec
Import your workflow and execution history, and every AI agent gets a score. Then connect the MCP Client Tool node so your own n8n agent can ask TorqueSight which step is failing, with no changes to the workflow it is watching.
python3 /path/to/torquesight/mcp-server/torquesight_mcp.py --http --port 8765Endpoint http://127.0.0.1:8765/mcp, transport HTTP Streamable.
See the n8n tab in InstallAvailable now
Design, audit, health, optimize, the risk register, the security preview, the nine-tab viewer, and importers for n8n, OpenTelemetry and Langfuse. Bring your own logs.
Coming soon
A delivery kit deployed in your own cloud that copies logs from CloudWatch, Azure Monitor, Datadog or Splunk on a schedule and hosts the console behind your own sign-in. Your data never leaves your account.
In the future
Hosted dashboards, alerts and history, plus the full visualization and security experience in one place. Opt-in, metadata only.
TorqueSight is open source under Apache-2.0, built by Juggernaut Dev. Works in Claude.ai, Claude Cowork, Claude Code and OpenAI Codex.